Are campaigns to encourage Covid-19 Vaccinations working?

This is the question currently plaguing communications teams across the country. Using traditional data science techniques, our team at Data Society engineered a solution to help communications professionals identify which campaign or methods are most effective for reaching their target audience – empowering the communications team to craft engagement that increases vaccinations in the target groups.
Our client, a large communications firm running Covid-19 Vaccination campaigns for a state department of health, came to us with two main questions: are our messaging campaigns for Covid-19 vaccinations impacting our target populations? And if so, which aspects of the campaign have the most impact on the number of vaccinated individuals?
The client had plenty of data. They used a CRM to track contacts and interactions from email and direct mail campaigns, a tracking tool for their social media impressions, and event registration management software for in-person and virtual grassroots events. But having this data on multiple platforms meant they weren’t able to see how all of these engagements contribute to the overall success of the campaign.
We started by pulling the data from CRM, social media impressions, and event management software into a cloud-based data infrastructure to organize and tag the data for event type and target demographics. It was important that as we integrated the campaign data with the vaccination data we anonymized it as best as possible. In this case, we aggregated vaccination data to the demographic group, the county, and the week for reporting purposes. We then visualized the aggregated data to show the relationship between the inputs and outputs of the communications campaign into easy-to-digest dashboards.
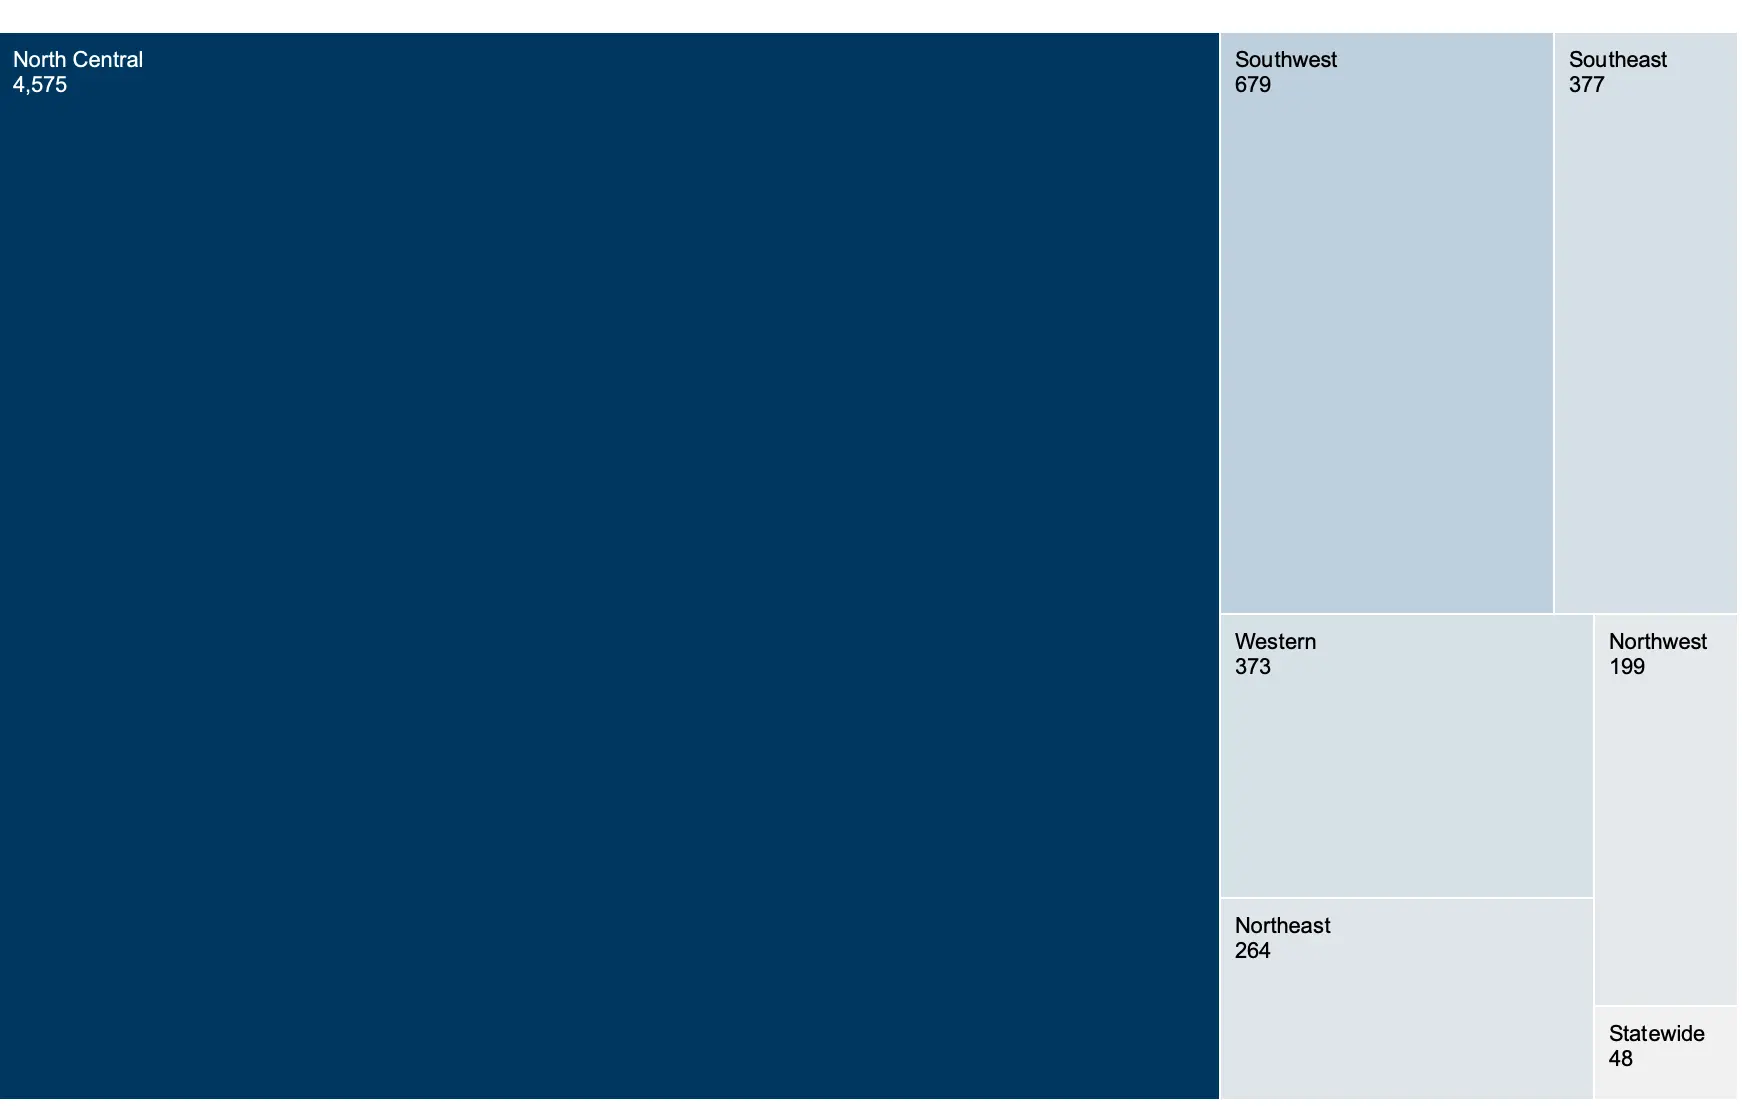
For this particular campaign, the client was interested in tracking the types of events and organizations, locations, and impact on historically marginalized populations, specifically, African Americans, Latin-X, and Native Americans. With each of the dashboards we created, our client can now see in real-time where engagements are happening, the percent of the target population affected, and the count of different engagement types.
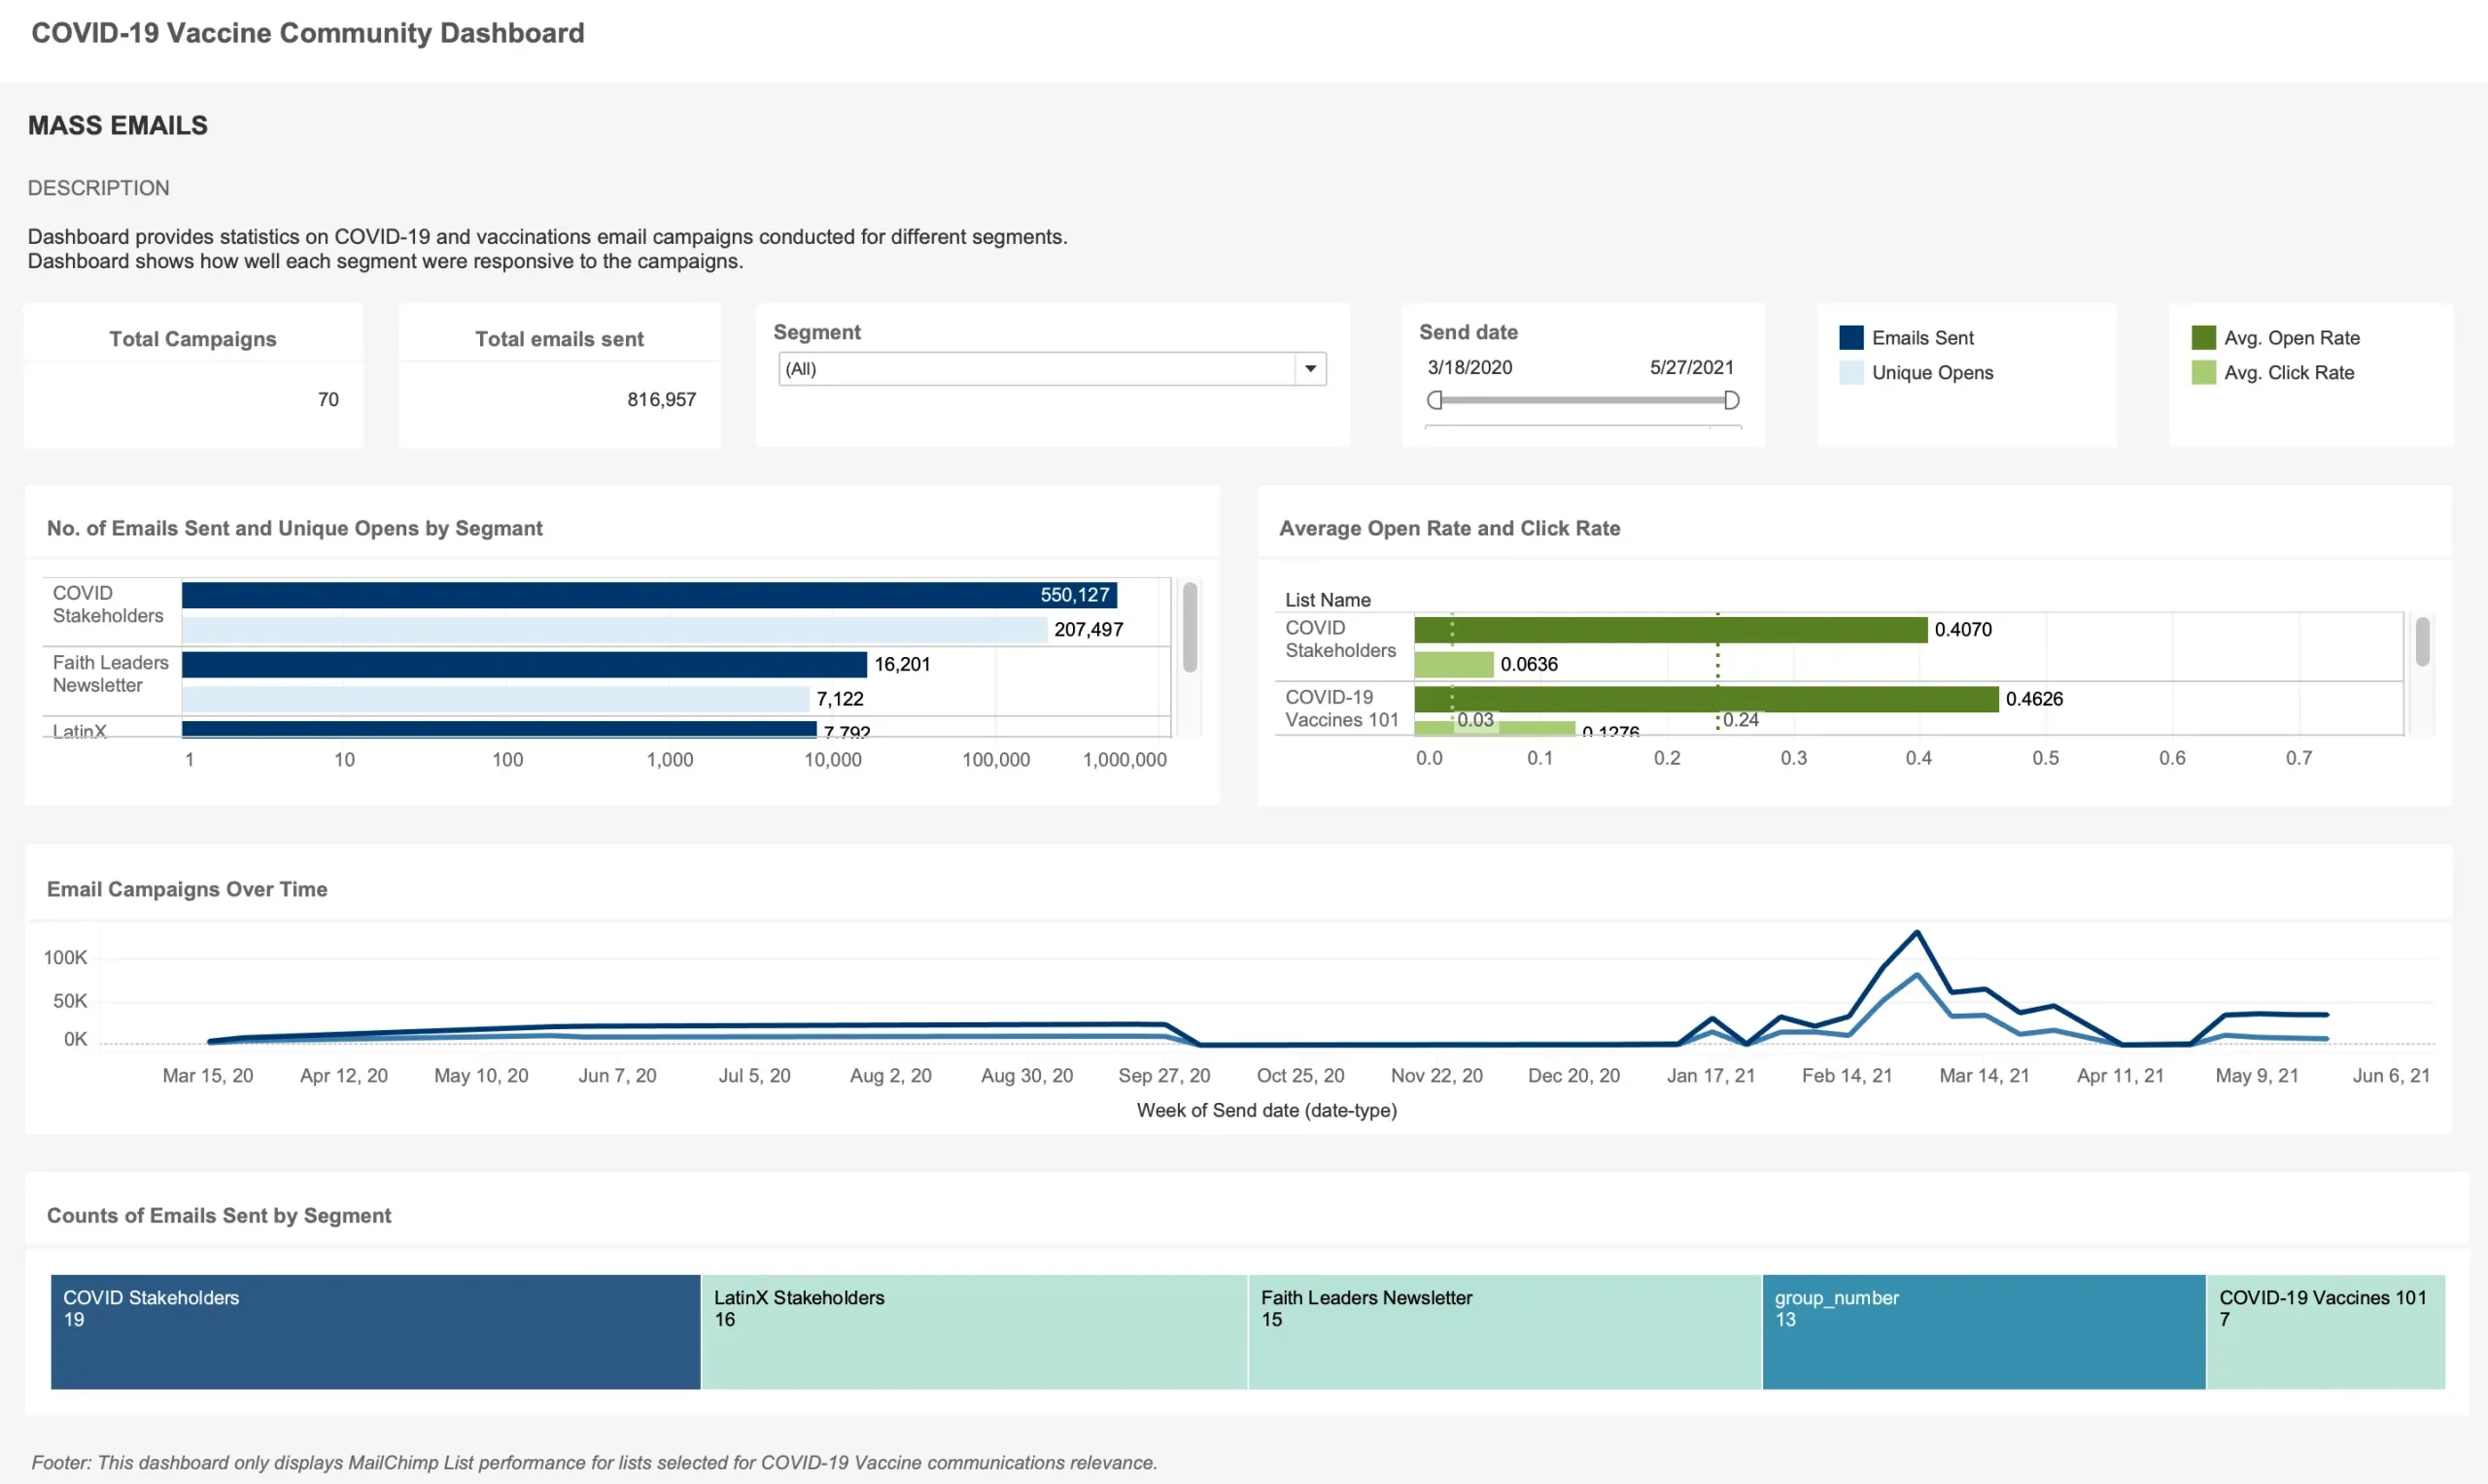
We pulled dashboards for the different engagement types the client is conducting. One engagement type we pulled into a dashboard is mass emails. The client was interested in seeing the performance of their different distribution lists based on the number of emails sent, unique open rates, and click rates. The client can sort the data to look at specific audiences or contact lists or see the overall performance of the mass email campaign as a whole.


We used advanced data science techniques to give further insights into campaign engagements where more data was available. For the social media dashboard, we were able to show sentiment analysis on different social media posts by topic. This information helps identify which message types resonate most with audiences, along with heat maps showing the location of posts and the number of posts about vaccination over time.
To get at the true impact of the campaign in terms of the number of additional vaccinations, reports based on regression analysis are produced weekly and show the impact of campaign activities to date. This analysis showed a statistically significant effect on vaccinations based on the community outreach efforts of our client. Based on media campaigns from January – April, our analysis showed that each community engagement effort (email exchange, call, or meeting) by our client is associated with an average of 280 additional vaccinations. Our analysis also showed that a single paid media impression is associated with 0.0017 increase in weekly vaccinations. With over 57 million impressions across the African American and Hispanic populations within the state thus far, the potential impact of those impressions has been 262,000 additional vaccinations (first dose).
Through our analysis, the client has shown the impact of their work and tailor ongoing engagements to increase vaccinations across the state. We were able to show that it is possible to glean insight out of messy communications campaign data. All it takes are the right tools and a data infrastructure tailored for your goals.

