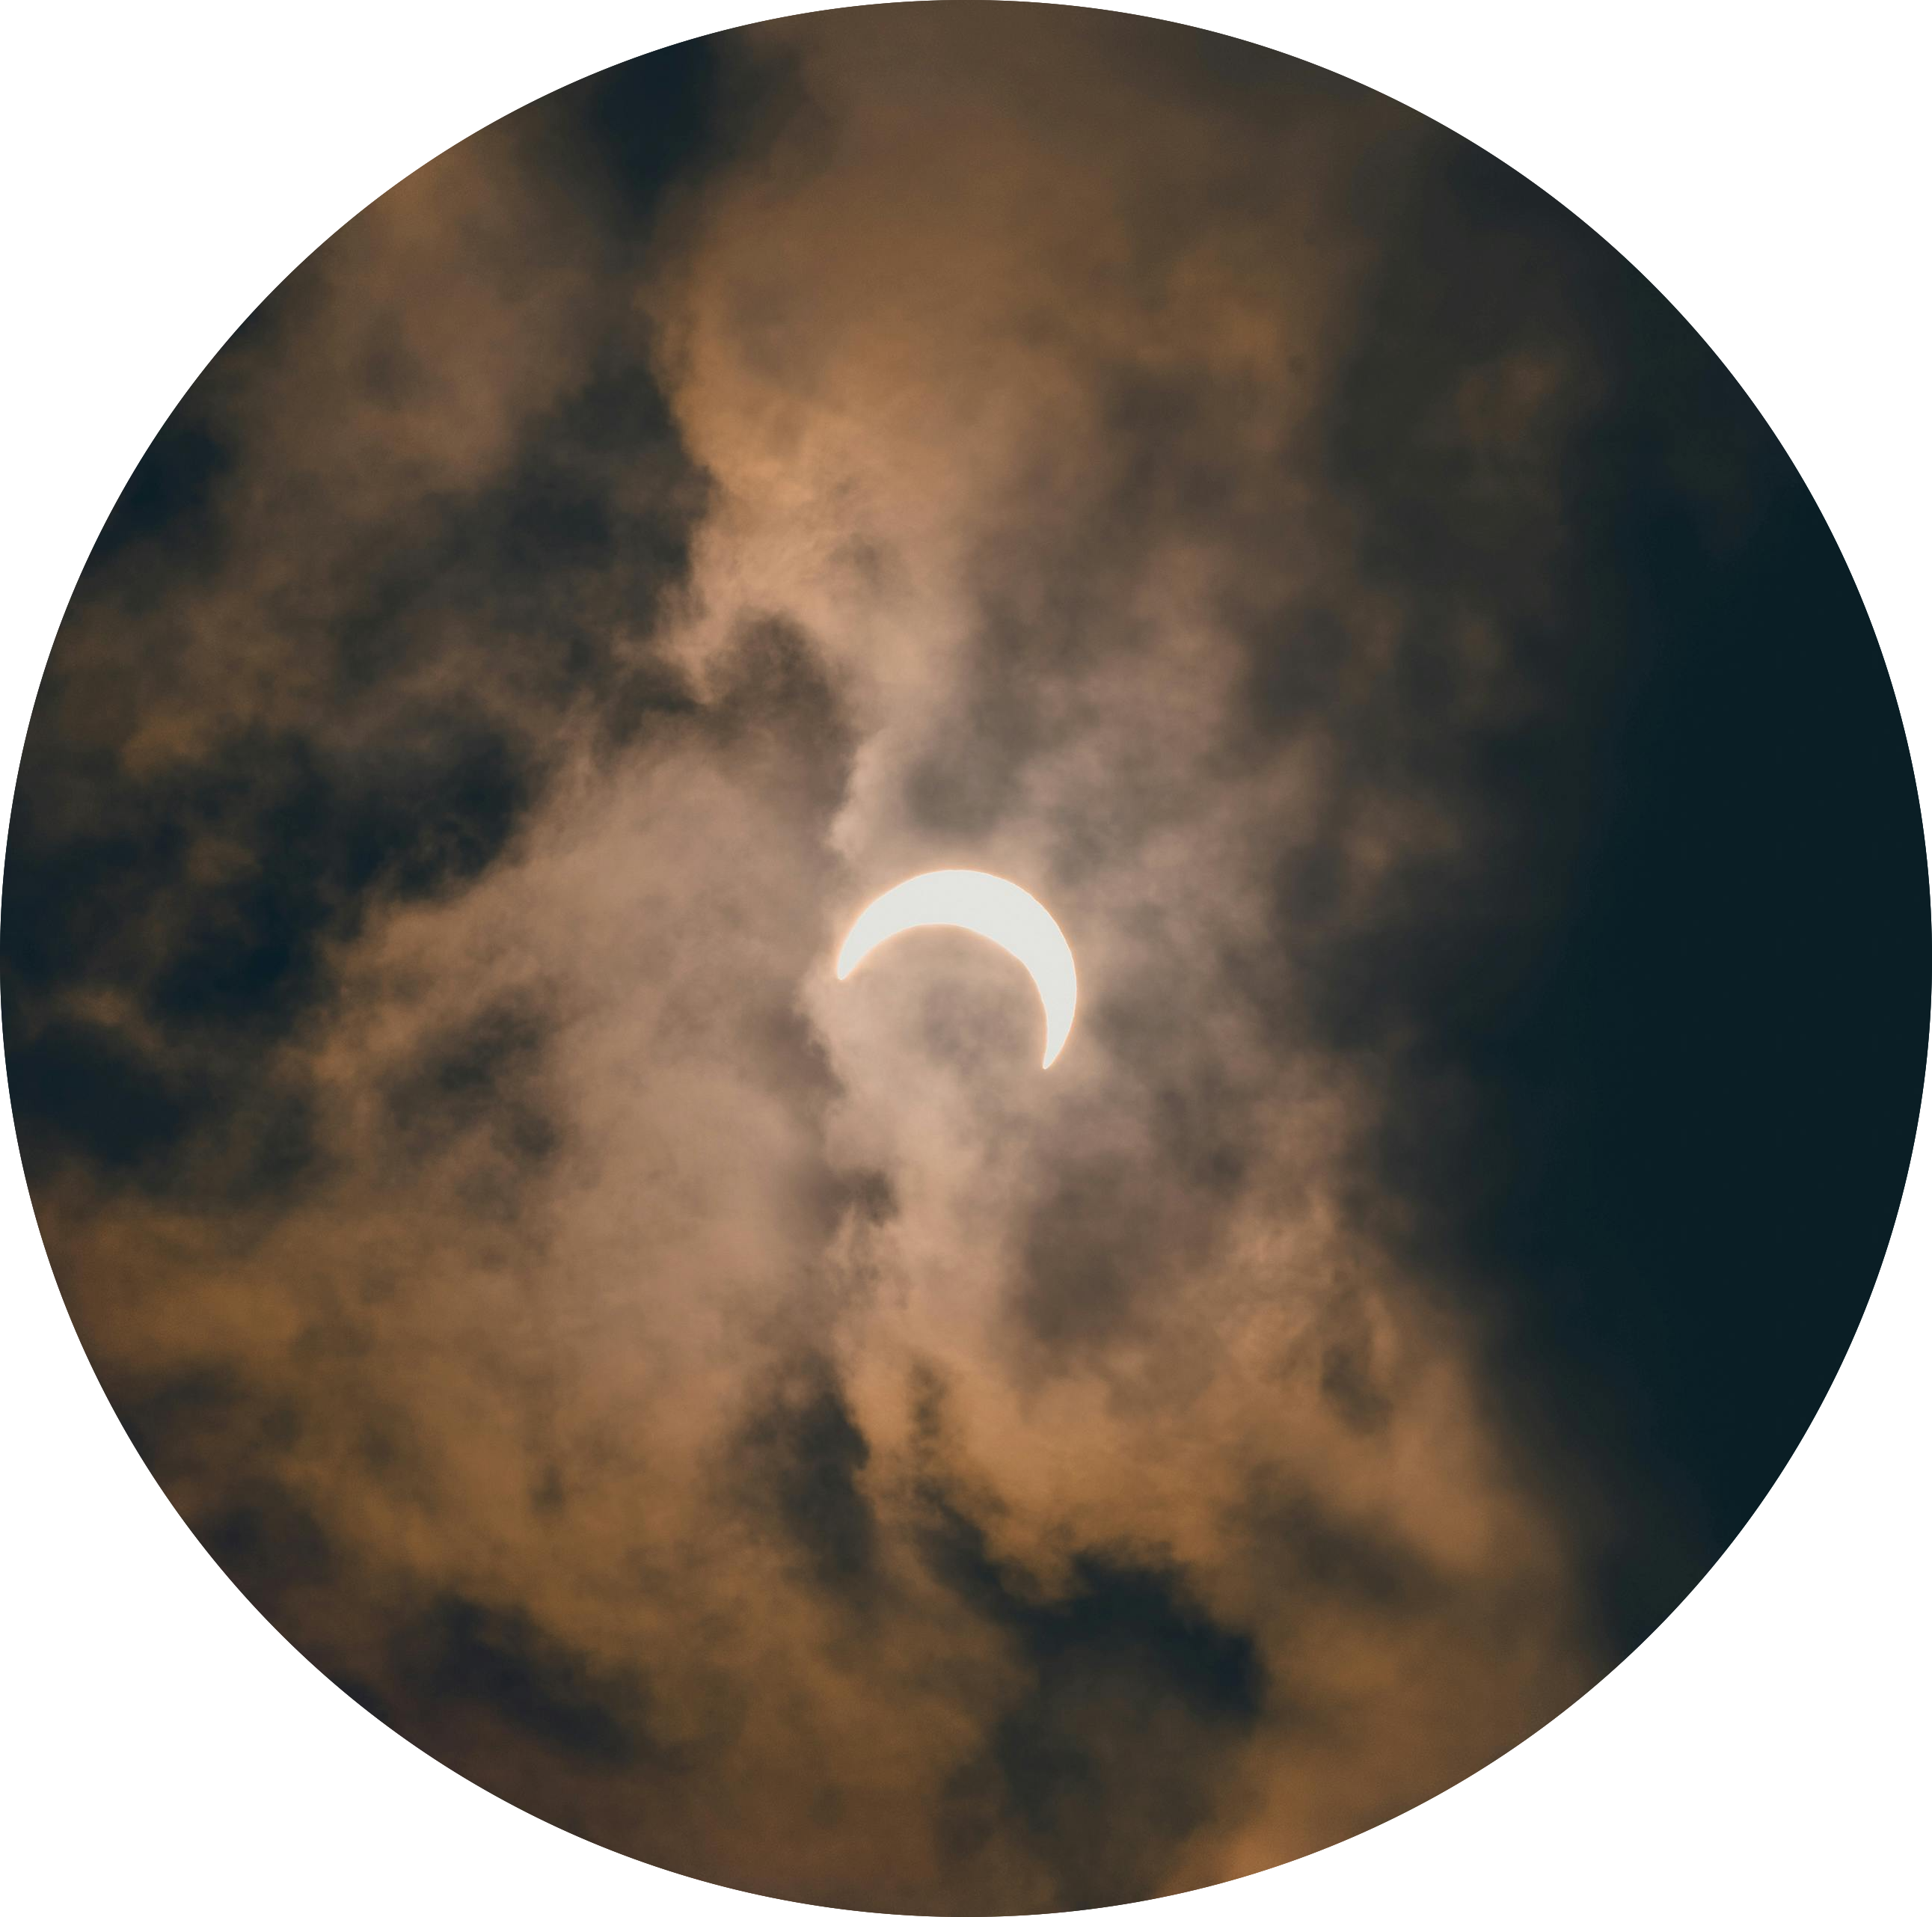
After much anticipation, the Great American Eclipse of 2024 has come and gone, leaving people in awe and communities and industries measuring the impact of this rare cosmic event. Science long ago demystified the when, where, and why of solar eclipses, beginning with early efforts to predict them by identifying patterns in historical data. Still, while eclipses are no longer the enigmas that sparked existential fears in ancient times, we continue to unravel the uncertainties surrounding how humans will behave in response to these phenomena.
Predicting travel and consumption trends during unusual events helps businesses prepare for impacts including flight delays and increased staffing and stocking needs. Industries such as the short-term rental business can leverage tourism forecasts to manage dynamic pricing and optimize their marketing investments.

For communities in or near the path of totality, local governments seek insights into what to expect in order to manage potential disruptions such as congested traffic and delays in emergency response. For example, to help emergency services track areas of potential concern, the Ohio Department of Transportation developed an interactive online map that used anonymized cellphone geodata, estimates visitor numbers, and travel data from states in the path of totality of the 2017 eclipse.
Preparing for these deviations from the norm is especially critical for smaller towns and areas that seldom see much tourism. For some communities in the path of totality, the fleeting spectacle of the eclipse is an opportunity to convert newcomers into repeat visitors and to gain insights into their towns’ potential as tourism destinations. Such was the motivation of a professor at Southern Illinois University who gathered social media data related to the 2017 and 2024 solar eclipses, both of which reached totality near his campus’ town of Carbondale, to study tourism patterns in his small community.
Because total solar eclipses are uncommon phenomena for any given location, we have precious few opportunities to develop insights into what to expect when these occasions do arise. GreatAmericanEclipse.com, an online resource for all things eclipse, tackles this challenge with ArcGIS software, US Census data, and a digital road network. The site provides detailed maps of locations within the path of totality and the routes to reach them by car. Assuming that most eclipse-seekers would opt to travel the shortest distance by car, GreatAmerricanEclipse.com’s analysts account for several variables, including planned viewing events, weather odds, and proximity to major highways and major population centers. For the 2024 total eclipse, the website’s visitation prediction model produced a wide-ranging forecast of between one and four million people traveling to the path of totality for the eclipse.
In the eclipse’s aftermath, it will take some time before many of the eclipse-related numbers will be available. For example, Burlington, VT, a popular destination for eclipse tourism this year, will compile sales and use tax and gross receipts to get a better idea of economic impact, and the Vermont Agency of Transportation will use smartphone geolocation data to quantify the increase in vehicle traffic across the state.
In the meantime, the team at Mapbox.com, a site that uses telemetry data to track movement data, notes that the change in on-the-ground activity on April 8 may have been the largest they have observed in a single day since they began tracking such metrics four years ago. The website reports an increase of 25% or more in activity in regions in the path of the eclipse. The site’s analysts speculate that the weather, a fickle force that confounds early estimates for travel, likely drove down the number of visitors to locations—such as parts of Texas—that saw cloudy conditions on eclipse day.
Travel patterns weren’t the only behaviors of interest during the eclipse. One forecast ahead of the 2017 solar eclipse estimated that the spectacular distraction in the sky could cost US businesses almost $700 million in lost productivity. Also, in anticipation of a spike in cell phone usage during this year’s total eclipse, the Washington Post published tips to help readers prepare for service disruptions in case cellular networks got overwhelmed.
However, a notable statistic that emerged from the Great American Eclipse of 2024 indicates that people disconnected for a moment as the sun disappeared that day. One study estimated that internet use within the path of totality dropped 40-60% from the week prior.
Is the takeaway from this insight that people in the path of totality stepped away from their devices to experience the moment? If so, it seems that human behavior really does continue to defy expectations. And it’s heartening to believe that, while eclipses may no longer be shrouded in the mystery that struck fear in our ancient ancestors’ hearts, their power to inspire awe endures.
Subscribe to get the latest updates from Data Society, including tips for how to use your data better, real-life examples of leveraging analytics, and more.